Posted on

Spinal Muscular Atrophy Testing Carrier Screening & Diagnostic Assay

Technical Brief:

Spinal Muscular Atrophy Carrier Screening & Diagnostic Assay


Test Name

Spinal Muscular Atrophy Carrier Screening and Diagnostic Assay (SMAGEN)

CPT Code

81329

Methodology

Multiplex Fluorescent Polymerase Chain Reaction (PCR)

Turnaround Time

4–7 days

Specimen Requirements

Type:
Peripheral blood

Volume:
4 mL

Minimum Volume:
0.5 mL

Tube/Container:
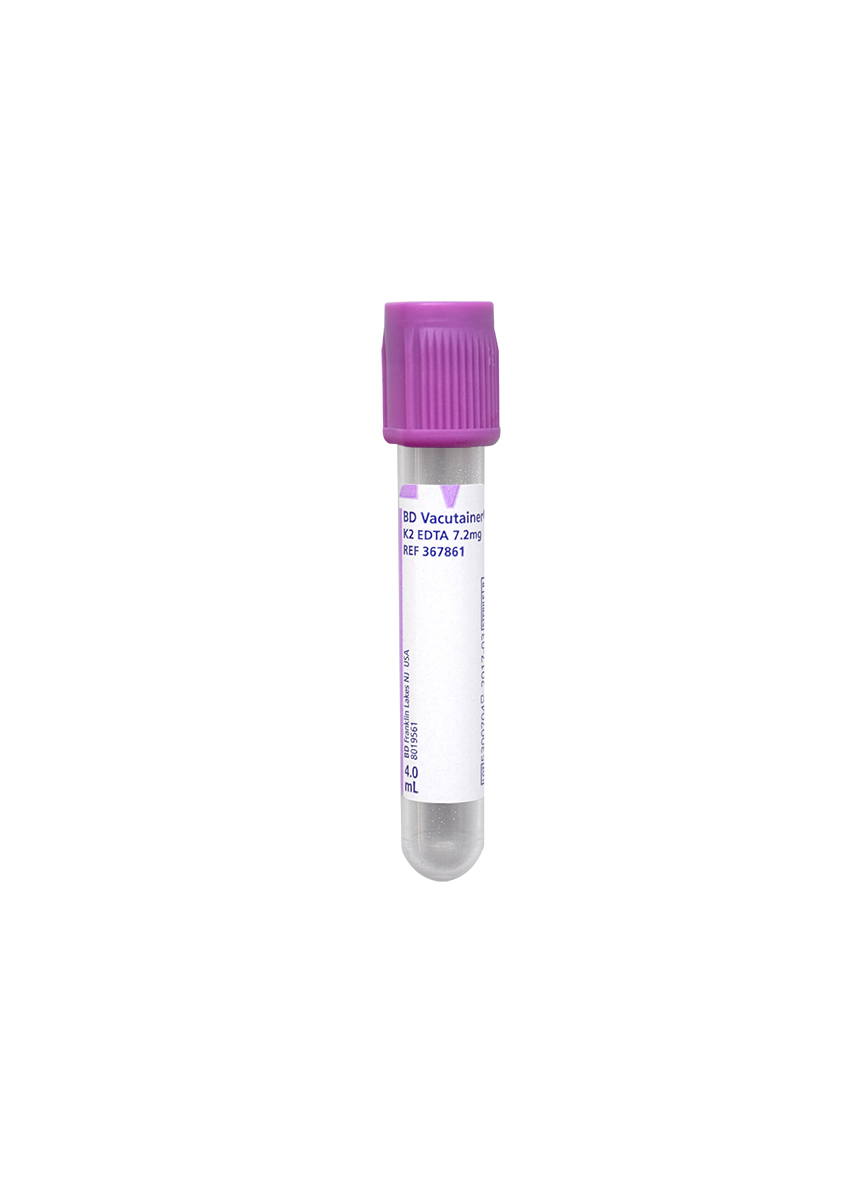
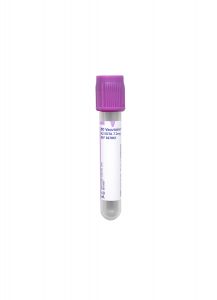
Lavender BD Hemogard™ K2EDTA Tubes

Transport Temperature:
Ambient (transported within 24 hours)

Due to difficulties associated with newborn and infant draws, smaller volumes may be submitted (note: a minimum of 0.5 mL is required).

Stability

Ambient:
48 hours

Refrigerated:
7 days (at 2-8 °C)

Frozen:
Unacceptable

Background Information

Spinal muscular atrophy (SMA) is an autosomal recessive neurodegenerative disorder, with an incidence of approximately 1 in 10,000 births. The condition has variable severity and age of onset and has been categorized into clinical types 0-IV (OMIM# 253300, 253550, 253400, 271150).

  • SMA I accounts for 60% of all SMA and has an onset of symptoms in infancy.
  • SMA 0 is rare and at the most severe end of the spectrum, correlating with prenatal onset of muscular weakness and neonatal respiratory failure.
  • SMA IV, while also rare, has the mildest presentation and correlates with adult-onset of muscle symptoms.

Treatment was previously limited to supportive care but is now available to prevent or slow the progression of SMA.

In all types, the genetic cause maps to an inverted duplication on chromosome 5q13.2. The complexity of the 5q13 region increases the likelihood of errors during DNA replication, resulting in a relatively high risk of deletions, gene conversions, and new mutations. SMN1 and SMN2 are two highly homologous genes located in this region, sharing more than 99% nucleotide identity. One difference between these genes affects protein coding, with alternative splicing of exon 7 in SMN2 that results in decreased production of the full length, functional SMN protein compared to SMN1. Both SMN1 and SMN2 produce the survival motor neuron (SMN) protein, with SMN2 producing just a small percentage of this protein, due to this alternate splicing. Therefore, with SMN1 accounting for the majority of SMN production, mutations in or deletions of SMN1 are the cause of the SMA phenotype.

The majority (95%) of patients with SMA have homozygous deletions of the SMN1 gene (noted as 0+0 genotype). Of the remaining 5%, most are heterozygous for a deletion of SMN1 on one chromosome and a small pathogenic, or disease-causing, variant in the SMN1 copy on the other chromosome (1+0 genotype). Pathogenic sequence variants are not detected by this test. There is no correlation between SMN1 copy number or presence of pathogenic variants and disease severity. Disease severity is inversely correlated with
the SMN2 gene copy number. In addition, the presence of the disease modifier variant c.859G>C is associated with reduced disease severity due to improved SMN2 splicing.

SMN1 copy number varies among healthy non-carrier individuals (1+1 or 2+1 genotypes). The SMA carrier rate is about 1 in 50 and varies with ethnicity (see table below). SMA carriers are also healthy. Most SMA carriers have a single copy of SMN1 on one chromosome, while the other copy is deleted (1+0 genotype). At least 4% of the population has two SMN1 copies on one chromosome (2+0 genotype), although the 2+0 genotype is more frequent in some ethnic groups, such as up to 27.5% in African-Americans. There are also reports of some carrier individuals having three copies of SMN1 on the same chromosome (3+0 genotype). Thus, the presence of three or more copies of SMN1 reduces, but does not entirely eliminate, the residual carrier risk.

Carrier risk estimates for individuals with 2 copies of SMN1 (2+0 genotype) may be further refined using the presence or absence of two common benign variants associated with SMN1 duplication, c.*3+80T>G in intron 7 and c.*211_*212del in exon 8. The presence of either variant indicates an increased risk of being a silent carrier (2+0 genotype) in some ethnicities. The presence or absence of these variants does not adjust the silent carrier risk for individuals with three copies of SMN1 (3+0 genotype). Neither SMN2 copy number nor presence or absence of the disease modifier variant c.859G>C impact carrier status.

Table 1: Residual SMA Carrier Risk after Negative Carrier Screen and Negative Family History
Residual risk for unlisted ethnicities is unknown.

Ethnicity

Carrier Rate

2 Copies SMN1
exon 7

3 Copies SMN1
exon 7

2 Copies SMN1
No variant detected

2 Copies SMN1
At least one variant detected

African American/Black

1:71

1:132

1:6997

1:375

1:39

Ashkenazi Jewish

1:56

1:514

1:5899

1:580

SMA carrier

Asian

1:50

1:719

1:5185

1:779

1:57

Asian Indian

1:50

1:428

1:5252

Not reported

Not reported

Caucasian/European

1:45

1:604

1:4719

1:814

1:12

Hispanic

1:83

1:641

1:7574

1:906

1:99

Iranian

1:16

1:96

1:1604

Not reported

Not reported

Israeli Jewish

1:38

1:450

1:4004

Not reported

Not reported

Spanish

1:40

1:781

Not reported

1:888

SMA carrier

Carrier Screening

Both the American College of Medical Genetics and Genomics and the American College of Obstetricians and Gynecologists recommend that SMA carrier screening be offered to all women/couples who are planning a pregnancy or are currently pregnant.

In individuals with a family history of SMA, it is best to obtain genetic test reports from family members before testing, to confirm the diagnosis and type of mutation. In a pan-ethnic U.S. population studied by Sugarman et al., the carrier detection rate through SMN1 dosage analysis is estimated at an average of 91%, though it ranges from 70.5% to 94.8% with ethnicity. The addition of the c.*3+80T>G and c.*211_*212del variants increases the detection of silent carriers (2+0 genotype).

Ethnicity-specific carrier and detection rates compiled from multiple studies are provided in the Table below.

Table 1: Residual SMA Carrier Risk after Negative Carrier Screen and Negative Family History
Residual risk for unlisted ethnicities is unknown.

Ethnicity

Carrier Rate

2 Copies SMN1
exon 7

3 Copies SMN1
exon 7

2 Copies SMN1
No variant detected

2 Copies SMN1
At least one variant detected

African American/Black

1:71

1:132

1:6997

1:375

1:39

Ashkenazi Jewish

1:56

1:514

1:5899

1:580

SMA carrier

Asian

1:50

1:719

1:5185

1:779

1:57

Asian Indian

1:50

1:428

1:5252

Not reported

Not reported

Caucasian/European

1:45

1:604

1:4719

1:814

1:12

Hispanic

1:83

1:641

1:7574

1:906

1:99

Iranian

1:16

1:96

1:1604

Not reported

Not reported

Israeli Jewish

1:38

1:450

1:4004

Not reported

Not reported

Spanish

1:40

1:781

Not reported

1:888

SMA carrier

Methodology

Multiplex Fluorescent Polymerase Chain Reaction (PCR) followed by Capillary Electrophoresis is used to detect SMN1 (NM_000344.3) and SMN2 (NM_017411.3) based on fragment size.

This test detects copy number of SMN1 exon 7, which is homozygously deleted in 95% of SMA patients, and copy number of SMN2 exon 7, which influences the severity of disease in affected patients. The test also detects three variants; c.*3+80T>G and c.*211_*212del associated with SMN1 gene duplication and c.859G>C associated with reduced disease severity due to improved SMN2 splicing. The c.*3+80T>G and c.*211_*212del variants are reported only for individuals with 2 copies of SMN1 as the presence of either variant indicates an increased risk of being a silent carrier (2+0 genotype). The disease modifier variant c.859G>C is reported only when zero copies of SMN1 are noted.

Variants interrogated using assembly GRCh38 hg38 (legacy name):

  • SMN1 NM_000344.3; rs143838139, c.*3+80T>G, g.70952074T>G (g.27134T>G)
  • SMN1 NM_000344.3; rs200800214, c.*211_*212del, g.70952646_70952647del
  • SMN2 NM_017411.3; rs121909192, c.859G>C, p.Gly287Arg, g.70076545G>C

Interpretation

Among patients with a clinical presentation suggestive of SMA, detection of zero SMN1 copies confirms the diagnosis. In symptomatic patients with one SMN1 copy, SMN1 gene sequencing should be considered to identify the small percentage of patients with heterozygous sequence variants or small deletions. Symptomatic patients with two SMN1 copies are unlikely to have SMA, though very rare cases of homozygous sequence variants have been reported.

Use of this test to predict the likelihood of disease in offspring must also take into consideration that 2% of SMN1 disease-causing variants occur de novo rather than being inherited. Due to the complex inheritance of SMA by SMN1 copy number, de novo variant, and/or pathogenic variant, SMA carrier testing will never provide 100% reassurance that carrier status is eliminated or zero.

SMA carrier testing of both reproductive partners will provide the best estimate of reproductive risk and is most useful for individuals with an increased residual carrier risk following this test. Genetic counseling may be appropriate based on clinical or family history.

References

1. Alías L, Bernal S, Calucho M, Martínez E, March F, Gallano P, Fuentes-Prior P, Abuli A, Serra-Juhe C, Tizzano EF. Utility of two SMN1 variants to improve spinal muscular atrophy carrier diagnosis and genetic counselling. Eur J Hum Genet. 2018 Oct;26(10):1554–57.

2. Bürglen L, Lefebvre S, Clermont O, Burlet P, Viollet L, Cruaud C, Munnich A, Melki J. Structure and organization of the human survival motor neurone (SMN2) gene. Genomics. 1996 Mar 15;32(3):479–82.

3. Carrier screening for genetic conditions. Committee Opinion No. 691. American College of Obstetricians and Gynecologists. Obstet Gynecol. 2017;129:e41–55.

4. Chen X, Sanchis-Juan A, French CE, Connell AJ, Delon I, Kingsbury Z, Chawla A, Halpern AL, Taft RJ; NIHR BioResource, et al. Spinal muscular atrophy diagnosis and carrier screening from genome sequencing data. Genet Med. 2020 May;22(5):945–53.

5. Feng Y, Ge X, Meng L, Scull J, Li J, Tian X, Zhang T, Jin W, Cheng H, Wang X, et al. The next generation of population-based spinal muscular atrophy carrier screening: comprehensive pan-ethnic SMN1 copy-number and sequence variant analysis by massively parallel sequencing. Genet Med. 2017 Aug;19(8):936–44.

6. Lefebvre S, Bürglen L, Reboullet S, Clermont O, Burlet P, Viollet L, Benichou B, Cruaud C, Millasseau P, Zeviani M, et al. Identification and characterization of a spinal muscular atrophy-d termining gene. Cell. 1995 Jan 13;80(1):155–65.

7. Luo M, Liu L, Peter I, Zhu J, Scott SA, Zhao G, Eversley C, Kornreich R, Desnick RJ, Edelmann L. An Ashkenazi Jewish SMN1 haplotype specific to duplication alleles improves panethnic carrier screening for spinal muscular atrophy. Genet Med. 2014 Feb;16(2):149–56.

8. MacDonald WK, Hamilton D, Kuhle S. SMA carrier testing: a meta-analysis of differences in test performance by ethnic group. Prenat Diagn. 2014 Dec;34(12):1219–26.

9. Mailman MD, Heinz JW, Papp AC, Snyder PJ, Sedra MS, Wirth B, Burghes AHM, Prior TW. Molecular analysis of spinal muscular atrophy and modification of the phenotype by SMN2. Genet Med. 2002 Jan;4(1):20–26.

10. Monani UR, Lorson CL, Parsons DW, Prior TW, Androphy EJ, Burghes AH, McPherson JD. A single nucleotide difference that alters splicing patterns distinguishes the SMA gene SMN1 from the copy gene SMN2. Hum Mol Genet. 1999 Jul;8(7):1177–83.

11. Prior TW, Nagan N, Sugarman EA, Batish SD, Braastad C. Technical standards and guidelines for spinal muscular atrophy testing. Genet Med. 2011 Jul;13(7):686–94.

12. Sugarman EA, Nagan N, Zhu H, Akmaev VR, Zhou Z, Rohlfs EM, Flynn K, Hendrickson BC, Scholl T, Sirko-Osadsa DA, Allitto BA. Pan-ethnic carrier screening and prenatal diagnosis for spinal muscular atrophy: clinical laboratory analysis of >72,400 specimens. Eur J Hum Genet. 2012 20:27–32.

13. Wirth B. An update of the mutation spectrum of the survival motor neuron gene (SMN1) in autosomal recessive spinal muscular atrophy (SMA). Hum Mutat. 2000;15(3):228–37.

14. Wirth B, Schmidt T, Hahnen E, Rudnik-Schöneborn S, Krawczak M, Müller-Myhsok B, Schönling J, Zerres K. De novo rearrangements found in 2% of index patients with spinal muscular atrophy: mutational mechanisms, parental origin, mutation rate, and implications for genetic counseling. Am J Hum Genet. 1997 Nov;61(5):1102–11.

15. For more information about SMA, please consult GeneReviews.org.

Posted on

Syphilis Serological Testing

Technical Brief:

Syphilis Serological Testing


Test Name

Syphilis Total with Reflex (SYPHTX)

CPT Codes

86780

Turnaround Time

1 – 3 days

Specimen Requirements

Type:
Serum

Volume:
1 mL

Minimum Volume:
0.5 mL*

Specimen Container:
Gold BD Hemogard™ Serum Separation Tube

Transport Temperature:
Refrigerated

*Submitting the minimum volume will not allow for repeat testing or add-ons. The required volume of 1 mL is preferred when possible.

Stability

Ambient:
24 hours

Refrigerated:
7 days

Frozen:
14 days

Methodology

Chemiluminescent microparticle immunoassay (CMIA) method for Syphilis Total Ab.

Agglutination method for RPR and enzyme immunoassay for confirmatory assay (TPAG).

Reference Range

Non-reactive

Reflex Information

If Syphilis Total (screen) is Reactive, RPR and/or TPAG may be ordered and billed, depending on the algorithm.

Background Information

Syphilis testing can be divided into two categories:

  • Treponemal assays (specific) measure antibodies directly react with the syphilis-causing organism T. pallidum subsp. pallidum.
  • Non-treponemal assays, including rapid plasma reagin (RPR) testing, measure antibodies against non-specific antigens, such as cardiolipin, lecithin, and cholesterol, released during treponemal infections.

In the traditional testing algorithm for diagnosing syphilis, patient serum is initially tested with a non-treponemal test, followed by confirmation with a specific/confirmatory treponemal test. This algorithm was popular because of the technical ease of performing the RPR relative to fluorescent treponemal antibody absorption (FTA-ABS) or Treponema pallidum particle agglutination (TP-PA) assays.

However, because the RPR test does not recognize treponemal-specific antibodies, a number of clinical situations could result in false-positive RPR results, including autoimmune diseases,[1] acute or chronic viral infections, recent immunizations, pregnancy, or drug addiction.[2–3] Most importantly, because RPR reactivity is a feature of active syphilis infection, the test could give false-negative results in latent or late syphilis. It may also test non-reactive during primary syphilis potentially leading to mother-to-child transmission; therefore, testing pregnant women using the traditional algorithm may culminate in catastrophic consequences.

The CDC recognizes another testing algorithm—the reverse algorithm—in which the patient’s blood is initially tested using a specific treponemal test and confirmed with a non-treponemal test.[4]

The algorithm below represents Cleveland Clinic’s recommended screening for syphilis serology testing:

Clinical Indications

A reactive syphilis total/screen test result with a non-reactive RPR confirmed by EIA (see algorithm) indicates that a person has been exposed to T. pallidum subsp. pallidum at some point in their life. However, this testing may remain reactive for life in most people who have had syphilis, even if they have received appropriate treatment. Therefore, a positive result does not indicate that the person currently has untreated syphilis, and the result should be confirmed with a non-treponemal test, such as RPR, to assess current disease activity.

During the first few weeks post-infection, both treponemal assays may test positive while RPR remains non-reactive.

Most patients become seronegative on non-treponemal tests following adequate treatment; however, some patients have a low RPR titer for extended periods when they present with late latent or tertiary disease, despite being adequately treated in the past.[5] These patients are referred to as being “serofast.”

Venereal disease research laboratory (VDRL) testing is used for the diagnosis of neurosyphilis, otosyphilis, and ocular syphilis using CSF specimens. It is not included in this algorithm and must be ordered separately where clinically warranted.

Limitations

Infants up to 18 months may have reactive syphilis total/screen test results. This may also be seen with RPR; however, it shows faster clearance kinetics and usually disappears in 4-6 weeks postnatally only where there is no congenital syphilis. The best approach would be to compare maternal and neonatal RPR titers collected at the same time; where there is at least 4-fold higher titer seen in the neonate, it should significantly raise suspicion for congenital syphilis. It is still important to order SYPHTX to ensure that the reactive RPR results are in the context of the actually reactive treponemal result.

Samples with very high antibody concentrations may produce false-negative results for the RPR test due to the prozone effect. This has always remained a concern among clinicians; however, in the lab, the so-called “rough” RPR results are blindly diluted to rule out the prozone phenomenon. Therefore, such possibility remains exceedingly rare.

Methodology

Multiplex flow immunoassay (MFIA) method for syphilis.

Total Ab. Agglutination method for RPR and enzyme immunoassay for the confirmatory assay (TPAG).

References

1. Catteral RD. Collagen disease and the chronic biological false positive phenomenon. QJ Med. 1961;117:41.

2. Harris A, Brown L, Portnoy J, Price EV. Narcotic addiction and BFP reactions in tests for syphilis. Public Health Rep. 1962;77:537.

3. Kaufman RE, Weiss S, Moore JD. Biologic false positive serological tests for syphilis among drug addicts. Brit J Vener Dis. 1974;50:350.

4. Pope, V., Use of Syphilis Test to Screen for Syphilis. Infect Med. 2004;21(8):399-404.

5. Pettit DE, Larsen SA, Harbec PS. Toluidine red unheated serum test, a non-treponemal test for syphilis. J Clin Micro. 1983;18:1141.

6. CDC, MMWR, Vol. 60 (5):133-140, 2011.

Posted on

Alpha-1 Antitrypsin (SERPINA1) Targeted Genotyping

Technical Brief:

Alpha-1 Antitrypsin (SERPINA1) Targeted Genotyping


Test Name

Alpha-1 Antitrypsin (SERPINA1) Targeted Genotyping (HA1AT)

CPT Codes

81332

Turnaround Time

7 days

Specimen Requirements

Type:
Peripheral blood

Volume:
4 mL

Minimum Volume:
1 mL

Specimen Container:
Lavender BD Hemogard™ K2EDTA Tube

Transport Temperature:
Ambient

Stability

Ambient:
48 hours

Refrigerated:
7 days

Frozen:
Unacceptable

Methodology

High Resolution Melt Analysis
Real-Time Polymerase Chain Reaction (RT-PCR)
Fluorescence Monitoring

Background Information

Alpha-1 antitrypsin deficiency (AATD) (OMIM#613490) is one of the most commonly inherited metabolic disorders in people of northern European ancestry, occurring in one in 3000-5000 individuals, and also occurs at lower frequencies in people from other regions. AATD predisposes an individual to chronic obstructive pulmonary disease (COPD), liver disease, panniculitis and C-ANCA-positive vasculitis. AATD is caused by pathogenic variants in SERPINA1 (RefSeq NM_001127701.0; GRCh38/hg38), the gene that encodes alpha-1 antitrypsin (AAT). Alpha-1 antitrypsin is an inhibitor of neutrophil elastase. Excess neutrophil elastase can destroy the alveolar walls of the lung, causing emphysema. Pathogenic variants in SERPINA1 can also cause accumulation of abnormal proteins in hepatocytes leading to chronic liver disease. AATD is inherited as an autosomal recessive condition and more than 150 variants in SERPINA1 have been described to date.

Alleles in AATD are named with the prefix PI* for “protease inhibitor,” another name for the AAT protein. Many pathogenic variants in SERPINA1 result in structurally abnormal AAT protein, which impairs secretion and results in plasma deficiency. The majority of patients with AATD have the PI*S (c.863A>T, p.Glu288Val, g.94380925) or PI*Z (c.1096G>A, p.Glu366Lys, g.94378610) alleles. The PI*S allele causes a structurally abnormal AAT with mild functional impact and low disease risk, unless combined with other pathogenic alleles. The PI*Z allele also encodes a structurally abnormal form of AAT with more severe dysfunction associated with higher risk of lung and liver disease. Approximately 95% of individuals with clinical manifestations of AATD have the PI*ZZ genotype. Other rare variants of SERPINA1 exist and can also cause lung and liver disease. The PI*F allele (c.739C>T, p.Arg247Cys, g.94381049) results in a quantitatively normal but functionally abnormal AAT, causing decreased binding to neutrophil elastase. Individuals with this variant may have normal AAT levels but have an increased risk for lung disease, especially when inherited along with PI*Z allele. The PI*I allele (c.187C>T, p.Arg63Cys, g.94383051), similar to the PI*S allele, causes some structural abnormality in AAT with mild functional impact. However, when inherited along with the PI*Z allele, PI*I confers a higher risk of lung and liver disease.

Serum alpha-1 antitrypsin levels typically correlate with the SERPINA1 genotypes as shown in Table 1. However, AAT levels can be significantly elevated in some clinical circumstances, which could mask AATD. Serum levels in patients with acute inflammation, cancer, non-AATD related liver disease, pregnancy, estrogen therapy, or blood transfusions may be discordant from genotype results.

Table 1

Genotype

Expected AAT Levels
(based on Bornhorst 2003 data)

Disease Risks

PI*MM

102-254 mg/dL

Standard lab reference range:
90-200 mg/dL (per Dati 1996)

No increased disease risks

PI*MS

86-218 mg/dL

No increased disease risks

PI*MZ

62-151 mg/dL

No increased disease risks

PI*MF

102-254 mg/dL

No increased disease risks

PI*MI

86-218 mg/dL

No increased disease risks

PI*SS

43-154 mg/dL

Possible pulmonary disease risk

PI*SZ

38-108 mg/dL

Possible pulmonary and hepatic disease risks

PI*ZZ

<52 mg/dL

Pulmonary and hepatic disease risks, risk of other AATD-related conditions (e.g., panniculitis)

PI*FS

86-218 mg/dL

Pulmonary disease risk

PI*IS

43-154 mg/dL

Possible pulmonary disease risk

PI*FZ

38-151 mg/dL

Pulmonary disease risk, possible hepatic disease risk

PI*IZ

38-108 mg/dL

Possible pulmonary and hepatic disease risks

PI*FF

102-254 mg/dL

Pulmonary disease risk

Clinical Indications

According to available guidelines:

Diagnostic testing is recommended for:

  • Adults with emphysema, COPD, or asthma that is incompletely responsive to bronchodilators
  • Individuals with unexplained liver disease
  • Asymptomatic individuals with persistent obstruction on pulmonary function tests with identifiable risk factors
  • Adults with necrotizing panniculitis
  • Siblings of adults with AATD

Testing may be considered for:

  • Adults with bronchiectasis without clear risk factors for bronchiectasis
  • Adolescents with persistent airflow obstruction
  • Asymptomatic individuals with persistent obstruction on pulmonary function tests with no identifiable risk factors
  • Adults with C-ANCA-positive vasculitis
  • Parents or children of adults with AATD
  • Screening for individuals >11 years of age in areas of AATD prevalence or in areas of high smoking rates

Methodology

Targeted variant analysis is performed using LightMix® and LightSNiP® melt curve technology (TIB MOLBIOL) on the LightCycler480 II (Roche) to identify four alleles of the SERPINA1 gene, PI*S, PI*F, PI*I and PI*Z, which combine to create the genotypes listed in Table 1.

Genomic DNA is isolated from the peripheral blood and four regions containing the variants of interest are amplified by PCR. Following PCR, the amplified DNA sequences are subjected to a temperature gradient, allowing fluorescently labeled probes targeted to each variant to bind to the double stranded DNA sequence and fluoresce. As the temperature increases, the probes dissociate, or “melt”, at a specific temperature based on the nucleotide sequence of the probe and fluorescence decreases. Measurement of fluorescence throughout the gradient allows the specific temperature at which melting occurs to be recorded. Mismatches between the probe and the DNA sequence cause the probe/DNA hybrid to be less stable and the probe to melt at a lower temperature, allowing discrimination between variant and normal.

Interpretation

This laboratory-developed test will not detect other mutations that may cause AATD.

Uncommon variants or polymorphisms in the regions of interest may affect the binding of LightMix® or LightSNiP® probes and may result in a false negative, false positive, or indeterminate result.

Absence of the S, Z, F, and I alleles is consistent with (but does not confirm) the normal, aka wild type, PI*MM genotype.

Importantly, there are over 100 known rare variants of SERPINA1 that are not detected in 201306.081 (1.20 rev) by this PCR test. Therefore, the correlation of the genotype with the patient’s serum alpha-1 antitrypsin level and clinical manifestations is strongly recommended.

When discrepancies exist between the enzyme level and targeted genotype results (e.g., the serum AAT level is low but no abnormal allele is identified by PCR), sequencing of the coding regions of the SERPINA1 gene to identify rare mutations should be considered.

References

1. Bornhorst JA, Greene DN, Ashwood ER, Grenache DG. α1-Antitrypsin phenotypes and associated serum protein concentrations in a large clinical population. Chest. 2013;143:1000-8.

2. Dati F, Schumann G, Thomas L, Aguzzi F, et al. Consensus of a group of professional societies and diagnostic companies on guidelines for interim reference ranges for 14 proteins in serum based on the standardization against the IFCC/BCR/CAP reference material (CRM 70), Eur J Clin Chem Biochem. 1996;34:517-520.

3. Rodriguez-Frias F, Miravitlles M, Vidal R, Camos S, Jardi R. Rare alpha-1-antitrypsin variants: are they really so rare? Ther Adv Respir Dis. 2012 Apr;6(2):79-85.

4. Sandhaus RA, Turino G, Brantly ML, Campos M, Cross CE, Goodman K, Hogarth DK, Knight SL, Stocks JM, Stoller JK, Strange C, Teckman J. “The Diagnosis and Management of Alpha-1 Antitrypsin Deficiency in the Adult.” Chronic Obstr Pulm Dis. 2016 Jun 6;3(3):668-682.

5. Silverman EK, Sandhaus RA. Clinical practice. Alpha 1-antitrypsin deficiency. N Engl J Med. 2009;360(26):2749-57.

6. Sinden NJ, Koura F, Stockley RA. The significance of the F variant of alpha-1 antitrypsin and unique case report of a PiFF homozygote. BMC Pulm Med. 2014 Aug 7;14:132.

7. Stoller JK, Aboussouan LS. A review of α1-antitrypsin deficiency. Am J Respir Crit Care Med. 2012;185(3):246-59.

8. Stoller JK, Lacbawan FL, Aboussouan LS. Alpha-1 Antitrypsin Deficiency. 2006 Oct 27 [Updated 2017 January 19]. In Adam MP, Ardinger HH, Pagon RA, et al., editors. GeneReviews. [Internet]. Seattle (WA): University of Washington, Seattle; 1993-2018. Available from: http://www.ncbi.nlm.nih.gov/books/NBK1519/

Posted on

Thyroid Stimulating Immunoglobulins (TSI) Assay

Technical Brief

Thyroid Stimulating Immunoglobulins (TSI) Assay


Test Name

Thyroid Stimulating Immunoglobulin (TSIGIM)

CPT Code

84445

Methodology

Chemiluminescent Immunoassay (CLIA)

Turnaround Time

1 – 4 days

Specimen Requirements

Type:
Serum

Volume:
0.5 mL

Minimum Volume:
0.35 mL

Specimen Container:
Gold BD Hemogard™ Serum Separation Tubes (SST)™

Transport Temperature:
Refrigerated

Submitting the minimum volume will not allow for repeat testing or add-ons.

Alternative Specimen

Type:
Plasma

Volume:
0.5 mL

Minimum Volume:
0.35 mL

Specimen Container:
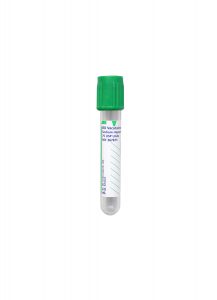
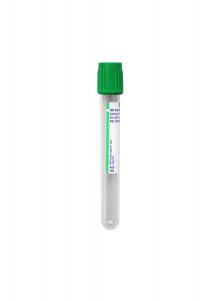
Light Green Lithium Heparin Plasma Separator Tube (PST)

Transport Temperature:
Refrigerated

Submitting the minimum volume will not allow for repeat testing or add-ons.

Stability

Ambient: 
24 hours

Refrigerated:
7 days

Frozen:
1 year (≤ -20°C)

Reference Range

<0.55 IU/L

Linear Range

0.10–40.00 IU/L

Clinical Information

The Thyroid Stimulating Immunoglobulin test is used as an aid in diagnosis of autoimmune hyperthyroidism, especially in patients with Grave’s orbitopathy and dermopathy. Low positive TSH receptor stimulating antibody levels may occasionally be found in patients with autoimmune hypothyroidism. Clinical correlation is required.

Background Information

Grave’s disease (GD) is the most common cause of hyperthyroidism. The clinical manifestations are protean and, to some extent, shared with those of Hashimoto thyroiditis (HT), which is a type of autoimmune hypothyroidism. The shared manifestations may include: muscle weakness, menstrual disturbances, hair and skin changes, decreased concentration, fatigue, goiter, and depression.

The autoimmune nature of Grave’s disease was established when the so-called long-activating thyroid stimulator (LATS) in sera from patients with Grave’s disease was able to induce hyperthyroidism in experimental animals. LATS were later found to be thyroid-stimulating hormone receptor (TSHR)-stimulating antibodies.

TSHR is a membrane receptor that belongs to a superfamily that contains hormone receptors for LH, FSH, and HCG. The extracellular domain (ectodomain, subunit A) of TSHR has several leucine-rich repeats (LRDs) that create a binding site for thyroid-stimulating hormones (TSH). Anti-TSHR stimulating and blocking autoantibodies bind to the same domain though with different Fab fragment orientations, the latter accounting for different downstream cellular events. TSHR stimulating antibodies (Abs) may have a higher affinity for the TSH binding site on TSHR and even displace TSH, thereby inducing unremitting thyroid hormone production and thyrocyte proliferation without being controlled by the physiological feedback mechanism. The latter antibodies typically belong to the IgG1 subclass.1–10 A well-characterized human monoclonal antibody (m22) from patients with GD was found to have TSHR-stimulating activity with high affinity (circa 6.7 × 10⁻¹¹ mol/L).8 The tests based on this antibody offer high clinical sensitivity and specificity.

Diagnosis of Grave’s disease is based on clinical grounds and on blood levels of free T3, free T4, and thyroid-stimulating immunoglobulins. This, however, can be aided by thyroid-stimulating immunoglobulins testing in certain circumstances, such as: i) when Grave’s orbitopathy (GO) or dermopathy is absent, but other results point to Grave’s disease; ii) in pregnant women with Grave’s disease; and iii) in patients on antithyroid drugs (ATDs) to determine if the medication can be discontinued.

It is important to note that Grave’s disease and Hashimoto thyroiditis are two extremes of an autoimmune spectrum: over time, patients may move from one extreme to the other or, at times, manifest a fluctuating course. There are TSHR-blocking Abs and anti-TSHR Abs that only bind to other parts of TSHR with different affinities; these may be of additional subclasses, such as IgG2 and IgG3. It is not uncommon to see patients with either Grave’s disease or Hashimoto thyroiditis that have both stimulating and blocking antibodies at the same time.

It appears that the titer and the avidity of the Ab population determine the outcome in some circumstances; however, it is pivotal to note that the final diagnosis and management decisions should not be solely based on TSI test results. What is more important than a qualitative TSI test result is the measurement of TSI concentrations in patients over a period of time; for instance, TSI is found in 7% of Hashimoto thyroiditis patients without Grave’s orbitopathy, but in 68% of Hashimoto thyroiditis patients with Grave’s orbitopathy.1–10

Additionally, by using blocking Ab bioassay, the prevalence of TSHR-blocking Abs among Grave’s disease and Hashimoto thyroiditis patients is established around 4% and 9%, respectively.11 Approximately 96% of Grave’s disease patients do not have TSHR-blocking Abs, thus obviating the need for distinguishing between the stimulatory and blocking antibodies in these patients. This avoids the costly and labor-intensive nature of bioassay without making a significant difference in patient management.

Methodology

The IMMULITE® 2000/2000 XPi TSI assay (Siemens) is FDA-approved for in vitro diagnostic purposes.

The test principle is based on automated, random-access, two-cycle chemiluminescent bridging immunoassay. The solid phase (polystyrene beads) are coated, through a monoclonal Ab, with a chimeric human TSHR (Mc4). In Mc4, the TSH binding site is intact, but its membrane-proximal part has been replaced by rat luteinizing hormone-choriogonadotropin receptor to not only stabilize the molecule so it can maintain its native form but also to preclude “other” TSHR-binding (but non-stimulating) Abs of binding to this chimeric molecule. Mc4 is also used by a commercial bioassay. During the second step, the capture TSHR is added, but the latter is conjugated to alkaline phosphatase (ALP), which will generate the chemiluminescent signal upon the addition of the substrate. The generated photons are read as relative light units, or counts per second, for calculations (Figure).

The kit uses two levels (low, high) of “adjustors” in replicates of four (logistical model). These are m22 Abs, as described above, and are used as calibrators based on which the final TSI concentration is calculated in international units per liter (IU/L).

The calibration is based upon a lot-specific master curve generated by the manufacturer. By using such adjustors and the test design, the stimulatory antibodies are typically measured. Furthermore, it has been demonstrated that stimulatory antibodies, such as m22, are able to bind to the concave region of TSHR LRDs where TSH also binds, whereas the blocking antibodies, such as K1-70, bind to the receptor more N-terminally and 155˚ away from where stimulatory antibodies bind.12 This key difference helps this kit to significantly avoid bridging the receptors by blocking antibodies due to steric hindrance, the latter of which is further accentuated by the upside-down nature of the signal receptor and presence of the conjugated ALP.

According to the manufacturer, this assay is traceable to WHO 2nd International Standard for thyroid-stimulating antibody, National Institute for  Biological Standards and Control (NIBSC), code: 08/204.

The kit also has three controls (negative, low, and high-positive) using m22 Ab. The reportable range is 0.10-40 IU/L, but the instrument can do further dilutions to calculate the final concentration. The manufacturer recommends 0.55 IU/L as the positivity cut-off based on which the clinical sensitivity and specificity are 98.6% and 98.5%, respectively. This is congruent with the most recent American Thyroid Association (ATA) guideline that states:

In the setting of overt thyrotoxicosis, newer TRAb binding and bioassays have a sensitivity of 96–97% and a specificity of 99% for GD. 7

It is noteworthy to mention that ATA did not specifically mention this test, and by “TRAb”, they referred to the two commercial ELISAs (TBI). TSI Immulite received FDA approval after the guideline was finalized. It was also previously demonstrated that TSI Immulite test had higher sensitivity than bioassay in patients with GD on ATDs.9 Furthermore, the manufacturer claims that IMMULITE® 2000/2000 XPi TSI test results are not affected in sera spiked by high concentrations of FSH, LH, TSH, HCG, anti-thyroglobulin, and anti-thyroid peroxidase.

Last but not least, a bioassay only measures cyclic adenosine monophosphate (cAMP); however, other TSHR activation pathways that do not result in cAMP production, such as phospholipase C cascade, are not assessed using current bioassays.  This is even of more importance when, in Grave’s orbitopathy, IGF-1 receptor forms a complex with TSHR to trigger orbital fibroblasts for glycosaminoglycan production and lipogenesis.6

Advantages

The IMMULITE® 2000/2000 XPi TSI assay analytically and clinically maintains high levels of quality and performance characteristics while significantly lowering the reagent cost and technologist’s time. In comparison, a bioassay requires cell culture, multiple reagents, ancillary tests, and manual calculations, all of which predispose this test to analytical and post-analytical errors, QC failures, lack of amenability to automation, and extreme labor intensiveness.  These factors adversely affect the cross-training of new technologists.

This test is performed at Cleveland Clinic on a random-access platform, Monday through Friday.  Tests can be added at any time during working hours without the need for batch-testing, obviating the prolonged bioassay turnaround time, as the former only takes 65 minutes to complete. This walk-away system immensely spares the laboratory technician’s time.

While Cleveland Clinic currently utilizes the IMMULITE®2000 system, another random-access, commercially-available platform is Elecsys® Anti-TSHR (Roche). However, in addition to the published reports9, 10 that show relatively poor performance, the test principle ultimately makes this option a sub-optimal choice: porcine TSH (instead of the Mc4 construct), murine monoclonal antibodies (that make heterophile Ab interference likely), the utilization of biotin (for conjugation of the latter Abs that make the test prone to falsely-elevated results due to dietary biotin), combined together argue against its usefulness for TSI testing.

Upon discussion with several other laboratories in the United States that have adopted the IMMULITE® 2000/2000 XPi TSI assay, each expressed high satisfaction.

Validation Summary

To verify the manufacturer’s claims, the TSI Immulite MMULITE® 2000/2000 XPi TSI test was validated in-house within the Immunopathology Laboratory on Cleveland Clinic’s main campus.

The linearity and accuracy study used a neat sample and multiple dilutions up to 1:250 in triplicate. The recovery rate, slope, intercept, and observed error were all within acceptable and established limits. For the precision study, the inter- and intra-run simple and complex precision was performed using low, medium, and high-level samples. The %CV values all were well within acceptable limits, confirming high precision, which is ideal for monitoring patients over time.

The method comparison study was performed in two parts:

  • One was performed using known positive sera (70% female, age: 24–78 years) received from ARUP Laboratories.  ARUP utilizes an in-house-developed bioassay. Our laboratories received samples within 128-480% (low to high positive); their test uses 123% as the positivity cut-off.
  • The second part was performed using sera received from the Ohio State University Laboratories, as they also utilize the IMMULITE® 2000/2000 XPi TSI assay.
  • Both panels showed 100% categorical agreement, confirming comparability.

According to our alternate proficiency testing results, our in-house bioassay had 100% concordance with the ARUP in-house-developed bioassay.

A carryover study used three replicates in low, high, low order, and three replicates of a high positive sample with 1:10 dilution. The results confirmed no significant instrument carryover.

The reference range study used apparently healthy subjects, as none tested positive for TSI (their TSI results were all <0.10 IU/L). This verified the manufacturer positivity cut-off of 0.55 IU/L.

References

1. Frank CU, Braeth S, Dietrich JW, Wanjura D, Loos U. Bridge Technology with TSH Receptor Chimera for Sensitive Direct Detection of TSH Receptor Antibodies Causing Graves’ Disease: Analytical and Clinical Evaluation. Horm Metab Res. 2015 Nov;47(12):880-8. doi: 10.1055/s-0035-1554662. Epub 2015 Jun 16.

2. McLachlan SM, Rapoport B. Thyrotropin-blocking autoantibodies and thyroid-stimulating autoantibodies: potential mechanisms involved in the pendulum swinging from hypothyroidism to hyperthyroidism or vice versa.

3. Nguyen CT, Sasso EB2, Barton L, Mestman JH. Graves’ hyperthyroidism in pregnancy: a clinical review. Clin Diabetes Endocrinol. 2018 Mar 1;4:4. doi: 10.1186/ s40842-018-0054-7. eCollection 2018.

4. Bitcon V, Donnelly J, Kiaei D. Sensitivity of assays for TSH-receptor antibodies. J Endocrinol Invest. 2016 Oct;39(10):1195-6. doi: 10.1007/s40618-016-0520-y. Epub 2016 Aug 16.

5. Tozzoli R, D’Aurizio F, Villalta D, Giovanella L. Evaluation of the first fully automated immunoassay method for the measurement of stimulating TSH receptor autoantibodies in Graves’ disease. Clin Chem Lab Med. 2017 Jan 1;55(1):58-64. doi: 10.1515/cclm-2016-0197.

6. Smith TJ, Hegedüs L. Graves’ Disease. N Engl J Med. 2016 Oct 20;375(16):1552-1565.

7. Ross DS, Burch HB, Cooper DS, Greenlee MC, Laurberg P, Maia AL, Rivkees SA, Samuels M, Sosa JA, Stan MN, Walter MA. 2016 American Thyroid Association Guidelines for Diagnosis and Management of Hyperthyroidism and Other Causes of Thyrotoxicosis. Thyroid. 2016 Oct;26(10):1343-1421.

8. Sanders J, Evans M, Premawardhana LD, Depraetere H, Jeffreys J, Richards T, Furmaniak J, Rees Smith B. Human monoclonal thyroid-stimulating autoantibody. Lancet. 2003 Jul 12;362(9378):126-8.

9. David J. Kemble, Tara Jackson, Mike Morrison, Mark A. Cervinski, Robert D. Nerenz. Analytical and Clinical Validation of Two Commercially Available Immunoassays Used in the Detection of TSHR Antibodies. DOI: 10.1373/jalm.2017.024067 Published October 2017.

10. Y Li, J Kim, T Diana, R Klasen, P D Olivo, and G J Kahaly. A novel bioassay for anti-thyrotrophin receptor autoantibodies detects both thyroid-blocking and stimulating activity. Clin Exp Immunol. 2013 Sep; 173(3): 390–397.

11. Diana T, Krause J, Olivo PD, König J, Kanitz M, Decallonne B, Kahaly GJ. Prevalence and clinical relevance of thyroid-stimulating hormone receptor-blocking antibodies in autoimmune thyroid disease. Clin Exp Immunol. 2017 Sep;189(3):304-309. doi: 10.1111/cei.12980.

12. Sanders P1, Young S, Sanders J, Kabelis K, Baker S, Sullivan A, Evans M, Clark J, Wilmot J, Hu X, Roberts E, Powell M, Núñez Miguel R, Furmaniak J, Rees Smith B. Crystal structure of the TSH receptor (TSHR) bound to a blocking-type TSHR autoantibody. J Mol Endocrinol. 2011 Feb 15;46(2):81-99. doi: 10.1530/JME-10-0127. Print 2011 Apr.

Posted on

Beryllium Lymphocyte Proliferation Test (Be-LPT)

Technical Brief

Beryllium Lymphocyte Proliferation Test (Be-LPT)


Test Name

LPT to Beryllium, Blood (BLDBE)

CPT Code

86353

Methodology

3H-thymidine uptake in cell culture

Turnaround Time

10 – 14 days

Specimen Requirements

Type:
Whole blood

Volume:
30 mL

Minimum Volume:
20 mL

Specimen Container:
Green BD Vacutainer™ Plus Sodium Heparin Plastic Plasma Tube

Transport Temperature:
Ambient

Specimens must be received by 3 p.m Mondays – Thursdays, and by 12 p.m. on Fridays.

Deliver the specimen to laboratories within 48 hours of collection.

Stability

Ambient: 
48 hours

Refrigerated:
Unacceptable

Frozen:
Unacceptable

Reference Ranges

PHA Stim Index:
≥50.0 SI

Beryllium 1.0 uM D5:
< 3.0 SI

Beryllium 1.0 uM D6:
< 3.0 SI

Beryllium 10 uM D5:
< 3.0 SI

Beryllium 10 uM D6:
< 3.0 SI

Beryllium 100 uM D5:
< 3.0 SI

Beryllium 100 uM D6:
<3.0 SI

Candida albicans:
≥ 2.0 SI

Background Information

Beryllium (Be) is a lightweight metal that can cause acute or chronic diseases that may be asymptomatic. Occupational exposure typically is responsible for this; however, for the most part, it occurs in individuals carrying certain HLA alleles such as HLADPB1 in 83%-97% of individuals with chronic beryllium disease (CBD). CBD is much more common than acute disease nowadays which is typically a chronic non-caseating granulomatous inflammation in individuals who develop beryllium-specific, cell-mediated immunity (typically CD4+ T cells). It is estimated that circa 140,000 workers in the United States are exposed to beryllium every year. Depending on the nature of the exposure and the HLA type, CBD will develop in up to 16% of exposed subjects; thus, CBD remains an important public and occupational health issue. Beryllium-sensitized individuals may remain asymptomatic for life, but approximately 6-8% develop CBD every year.1

Testing for an individual’s sensitivity to beryllium is performed with an in vitro lymphocyte proliferation test (LPT). This is used not only as a screening assay but also as a part of the diagnostic criteria for CBD.

Clinical Indications

Beryllium is a lightweight metal with a high melting point, high strength, and good electrical conductivity. As a result, beryllium has become widely used in a variety of industrial applications, such as thermal coating, nuclear reactors, rocket heat shields, micro-circuits, brakes, X-ray tubes, golf clubs, ceramics, and dental plates. Frequently, it is formulated as an alloy or an oxide.

Correlation between the clinical status of CBD (chronic beryllium disease) and in vitro responses to beryllium in an LPT was developed.2 An elevated blood Be-LPT result may indicate beryllium sensitization, but a definitive diagnosis of CBD requires lung biopsy in the context of compatible signs and symptoms and radiological findings; therefore, as a follow-up step, individuals may undergo pulmonary evaluation, including bronchoscopy, trans-bronchial biopsy, or BAL collection for BAL Be-LPT. This is important in the differential diagnosis of CBD, as sarcoidosis can clinically mimic CBD. Extra-pulmonary CBD may also be occasionally seen such as cutaneous nodules.

Methodology

The blood lymphocyte proliferation test for beryllium sensitization (Be-LPT) is measured by radioactive 3H-thymidine uptake in a cell culture system on two different days after exposure to a range of beryllium sulfate to re-stimulate effector memory CD4+ T cells in peripheral blood. As a control, a common mitogen, phytohemagglutinin (PHA), and Candida antigen are used to ensure acceptable and normal T cell proliferative responses. Emitted beta rays are counted by a beta counter instrument in count per minute (CPM), the stimulation index (SI) is calculated and reported out along with an interpretive comment. The results are reviewed by staff.

Interpretation

The S.I. for PHA should be ≥50.0.

The S.I. for Candida albicans should be ≥2.0 to indicate normal T-cell function.

If all six beryllium indices are less than 3.0, this signifies a normal result, meaning no evidence of beryllium sensitization.

Ratios of greater-than-or-equal-to 3.0 in two or more beryllium indices constitute an abnormal response that is compatible with beryllium hypersensitivity.

References

1. McCanlies EC, Kreiss K, Andrew M, Weston A. 2003. HLA-DBP1 and chronic beryllium disease: a HuGE review. Am. J Epidemiology. 157:388-398.

2. Deodhar SD, Barna BP, Van Ordstrand HS. 1973. A study of the immunologic aspects of chronic berylliosis. Chest. 63:309-313.

3. Barna BP, Culver DA, Yen-Lieberman B, Dweik RA, Thomassen MJ. Clinical application of Beryllium Lymphocyte Proliferation Testing. Clin and Diag Lab Immunol. 2003;10:990-994.

4. U. S. Department of Labor, Occupational Safety and Health Administration. Directorate of Science, Technology and Medicine Office of Science and Technology Assessment, Safety and Health Information Bulletin, September 2, 1999.

Posted on

Herpes Simplex Virus / Varicella-Zoster Virus Detection from Lesions

Technical Brief

Herpes Simplex Virus / Varicella-Zoster Virus Detection from Lesions


Test Name

HSV 1 & 2 / VZV Amplification – Herpes Simplex Virus and Varicella-Zoster Virus, Molecular Detection (HSVVZV)

CPT Codes

87529 – QTY (2)
87798

Methodology

Probe Amplification

Turnaround Time

0 – 3 days

Specimen Requirements

Type:
Swab

Only swabs collected from active cutaneous lesions (vesicles of any skin site) and mucocutaneous lesions are acceptable for testing.

Source:
Genital Lesions (penis; vaginal/cervical)
Skin Lesions
Nares Lesions
Ocular Lesions
Oral Lesions

Specimen Container:
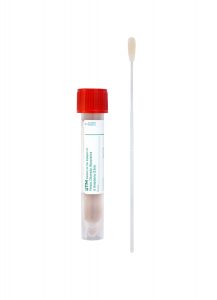
Universal Transport Media (UTM): Regular-Tipped Flocked Swab

CSF Specimens: refer to Herpes Simplex Virus by PCR, CSF (HSPCRC). Transport at ambient temperature up to 30°C for up to 48 hours. Transport on ice pack if warmer temperatures are to be expected.

The following specimen sources are not validated and could be sent out for testing: plasma, serum, amniotic fluid, BAL, and tissue (refer to HSV PCR, Miscellaneous Specimen Types – PCRHSV).

Stability

Ambient: 
48 hours (up to 30°C)

Refrigerated:
7 days (2 – 8°C)

Frozen:
7 days (-20°C)

Background Information

Herpes simplex viruses (HSV) (Types 1 and 2) and Varicella-Zoster virus (VZV) are important causes of vesicular lesions. In many instances, laboratory testing is not needed to prove the presence of the virus; for example, if a patient presents with shingles in a classic dermatomal distribution, then the diagnosis is made based on the clinical findings, and laboratory testing for VZV is not needed. However, in other instances, laboratory testing is essential to demonstrate the presence of the virus (e.g., low-level viral shedding from a mucous membrane-associated lesion). Laboratory studies are also important for differentiation of HSV and VZV when the clinical presentation is not characteristic (e.g. shingles in the genital region).

Clinical Indications

The Symptomatic Patient: This test should be ordered when the cause of vesicular or similar lesion is uncertain.

The Asymptomatic Patient: Asymptomatic vaginal shedding of HSV is a risk factor for the baby during delivery. This test is warranted in pregnant women who are near delivery if there is a concern for the possibility of HSV shedding.

Interpretation

Qualitative test results (i.e. Positive or Negative for HSV1, HSV2, or VZV) will be reported.

Methodology

The Solana HSV 1+2/ VZV Assay is an FDA-approved isothermal amplification assay that detects and differentiates HSV1, HSV2, and VZV. Clinical studies performed at Cleveland Clinic (manuscript in preparation) have demonstrated a 94.7% sensitivity and 100% specificity for the detection of HSV with this assay. The formerly-employed assay (i.e. HSV ELVIS Test System) had a sensitivity and specificity of 71.1% and 93.2%, respectively.

Similarly, the detection of VZV with Solana was superior to direct immunofluorescence (DFA). The sensitivity/ specificity of the Solana assay for the detection of VZV in this study was 95.3%/100%, whereas for DFA these were 71.4%/100%, respectively.

Limitations

This test has limited sensitivity. In rare circumstances, false positives may occur if other intracytoplasmic inclusions are present; however, if the peripheral blood smear is negative, and these diseases are suspected, PCR testing and/or serologic studies are recommended to aid in diagnosis.

References

1. Faron M, Mashock M, Connolly J, Ledeboer N, Buchan B. Evaluation of the Solana HSV 1+2 assay for simultaneous detection of herpes simplex virus 1 and 2, and varicella zoster virus from cutaneous lesions. Session P091; P1894. 27th ECCMID. Vienna, Austria. 22-25 April 2017.

2. Granato PA, Degillo MA, Wilson EM. The unexpected detection of varicella-zoster in genital specimens using the Lyra™ Direct HSV1+2/VZV Assay. J Clin Virol 2016; Nov;84:87-89. doi: 10.1016/j.jcv.2016.10.007. Epub 2016 Oct 11.

3. Huppert JS, Batteiger BE, et al. Use of an Immunochromatographic Assay for Rapid Detection of Trichomonas vaginalis in Vaginal Specimens. Journal of Clinical Microbiology. 2005; 684-687.

4. Solana HSV 1+2/VZV Assay product information and package insert, Quidel, San Diego, CA 92130.

Posted on

Ehrlichia & Anaplasma Peripheral Blood Smear Review

Technical Brief

Ehrlichia & Anaplasma Peripheral Blood Smear Review


Test Name

Microscopic Examination for Ehrlichia and Anaplasma (EHRLSM)

CPT Codes

87207

Methodology

Giemsa Prepared Thin Smears

Turnaround Time

7 days

Specimen Requirements

Type:
Whole blood

Volume:
5 mL

Minimum Volume:
1 mL

Specimen Container:
Lavender BD Hemogard™ K2EDTA Tube

Transport Temperature:
Ambient

Alternative Specimen

Type:
Whole blood

Volume:
5 mL

Minimum Volume:
1 mL

Specimen Container:
Green BD Hemogard™ Sodium Heparin Tubes

Transport Temperature:
Ambient

Stability

Ambient:
24 hours

Refrigerated:
Unacceptable

Frozen:
Unacceptable

For optimal results, smears must be prepared within several hours of collection.

Background Information

Ehrlichiosis and anaplasmosis are two closely-related tick-borne diseases caused by different and related small obligate intracellular bacteria. Ehrlichiosis is caused by one of several species of bacteria belonging to the genus Ehrlichia, while anaplasmosis is caused by the bacterium Anaplasma phagocytophilum. Both diseases are concentrated east of the Rocky Mountains, with ehrlichiosis found mainly in mid-Atlantic, southeastern, and south-central states, and anaplasmosis occurring most frequently in the Northeast and upper Midwest areas that are endemic for Lyme disease.

Ehrlichiosis and anaplasmosis are emerging infectious diseases in the United States and other countries and were first recognized as illnesses reportable to the CDC in 1999. According to the National Institute of Allergy and Infectious Disease, 1,009 cases of anaplasmosis, 957 cases of ehrlichiosis, and 132 ehrlichial diseases of undetermined type were reported to the CDC in 2008.

Symptoms often begin one to two weeks following an infected tick bite. Clinical manifestations can be mild or life-threatening, resembling those of Rocky Mountain spotted fever, and are often characterized by sudden high fever, fatigue, chills, muscular aches, and headache.

If left untreated, ehrlichiosis can become a severe, life-threatening disease. Severely-ill patients may have low white blood cell count, anemia, elevated liver enzymes, kidney failure, and respiratory insufficiency; other complications can include seizures and coma. Older patients or those with immune suppression are more likely to require hospitalization. Several deaths have been reported.

Possible complications of anaplasmosis include sepsis and damage to the lungs, heart, kidneys, and nerves. Like ehrlichiosis, the disease is noted for being more severe among individuals with compromised immune systems.

Clinical Indications

A patient with feverish symptoms following tick exposure may suspect ehrlichiosis/anaplasmosis. This test is for individuals who are thought to possibly have ehrlichiosis/ anaplasmosis based on symptoms and clinical presentation.

Morulae may be observed in white blood cells with a peripheral blood smear. Although these intracytoplasmic bodies are not frequently seen, their presence is highly-specific if detected by an experienced microscopist.

Interpretation

A positive result indicates the presence of intracytoplasmic morulae. Determining the type of white blood cell that is infected aids in the differentiation between ehrlichiosis and anaplasmosis.

While the specificity of this assay is high, its sensitivity is limited; a negative result does not exclude the possibility of anaplasmosis or ehrlichiosis.

Methodology

Peripheral blood smear (thin film) review following standard Giemsa staining.

Limitations

This test has limited sensitivity. In rare circumstances, false positives may occur if other intracytoplasmic inclusions are present; however, if the peripheral blood smear is negative, and these diseases are suspected, PCR testing and/or serologic studies are recommended to aid in diagnosis.

References

1. National Institute of Allergy and Infectious Disease. Ehrlichiosis and Anaplasmosis. http://www.niaid.nih.gov/topics/ehrlichiosisanaplasmosis/Pages/Default.aspx. Accessed Feb. 1, 2013.

2. Garcia, Lynne S., ed., et. al. Clinical Microbiology Procedures Handbook, 3rd ed., ASM Press, Washington D.C., 2010, Chapters 2.1.17, 3.4.1.17, 11.7.1-11.7.7.

3. Howard, Barbara J., et. al. Clinical and Pathogenic Microbiology, 2nd ed., Mosby Year Book, St. Louis, 1994, pgs. 859-890.

4. Mahon, Connie R., Textbook of Diagnostic Microbiology, 3rd ed., Saunders Elsevier, St. Louis, Mo., 2007, pgs. 1068-1069.

5. Versalovic, James, ed., et al. Manual of Clinical Microbiology, Vol. 1, 10th edition, ASM Press, Washington D.C., 2011, pgs. 240, 1013-1026.

Posted on

CEBPA Mutation Analysis

Technical Brief

CEBPA Mutation Analysis


Test Name

CEBPA Mutation Analysis, Blood (CEBPA)

CEBPA Mutation Analysis, Marrow (CEBPAM)

CPT Codes

81218

Methodology

Next-Generation Sequencing

Turnaround Time

10 days

Specimen Requirements

Type:
Aspirate, bone marrow

Volume:
2 μg

Specimen Container:
Lavender BD Hemogard™ K2EDTA Tube

Type:
Blood, whole

Volume:
4 mL

Minimum Volume:
2 mL

Stability

Ambient:
48 hours

Refrigerated:
7 days

Frozen:
Unacceptable

Reference Range

CEBPA mutations are not detected.

Background Information

Mutations in the CEBPA gene are identified in 15-18% of acute myeloid leukemia (AML) with normal cytogenetics, and acute myeloid leukemia with mutated CEBPA represents a provisional diagnostic entity in the 2008 WHO classification.[1]

Acute myeloid leukemia with mutated CEBPA displays distinct clinicopathologic features including a favorable clinical course, and the identification of CEBPA mutations may assist in treatment selection.[2-6] CEBPA mutation analysis is recommended for cases of acute myeloid leukemia with normal cytogenetics in the current National Comprehensive Cancer Network (NCCN) and European LeukemiaNet guidelines.

Clinical Indications

Cleveland Clinic Laboratories offers CEBPA mutation analysis for classification and prognostic assessment of new acute myeloid leukemias, especially those with normal cytogenetics. Concurrent NPM1 and FLT3 studies are also recommended.

Interpretation

Mutations in CEBPA include single and dual (usually biallelic) mutations. Initial studies reported that the presence of any CEBPA mutation was associated with a favorable clinical course, while more recent studies have suggested that the favorable clinical course and distinctive clinicopathologic features are limited to acute myeloid leukemia with dual CEBPA mutations.[2-6]

All identified mutations are reported.  Cases are classified as wild type (no mutations detected), single mutated, or dual mutated.

Methodology

DNA is extracted from peripheral blood (CEBPA) or bone marrow (CEBPAM). The entire CEBPA coding region is amplified by PCR and analyzed by Sanger sequencing.

Limitations

Sanger sequencing is expected to identify >99% of mutations, provided that mutations represent at least 15-20% of total CEBPA alleles.

This test is not intended for the detection of minimal residual disease.

References

1. Arber DA et al. (2008). Acute myeloid leukaemia with recurrent genetic abnormalities. In: Swerdlow SH, Campo E, Harris NL et al., eds. WHO Classification of Tumours of Haematopoietic and Lymphoid Tissues. 4th ed. Lyon, France: WHO Press. 110-23.

2. Taskesen E, Bullinger L, Corbacioglu A, et al. Prognostic impact, concurrent genetic mutations and gene expression features of AML with CEBPA mutations in a cohort of 1182 cytogenetically normal AML patients: further evidence for CEBPA double mutant AML as a distinctive disease entity. Blood. 2011;117:2469-2475.

3. Green CL, Koo KK, Hills RK, et al. Prognostic significance of CEBPA mutations in a large cohort of younger adult patients with acute myeloid leukemia: impact of double CEBPA mutations and the interaction with FLT3 and NPM1 mutations. J Clin Oncol. 2010;28:2739-47.

4. Dufour A, Schneider F, Metzeler KH, et al. Acute myeloid leukemia with biallelic CEBPA gene mutations and normal karyotype represents a distinct genetic entity associated with a favorable clinical outcome. J Clin Oncol. 2010;28:570-7.

5. Pabst T, Eyholzer M, Fos J, et al. Heterogeneity within AML with CEBPA mutations: only CEBPA double mutations, but not single CEBPA mutations are associated with favorable prognosis. Br J Cancer. 2009;100:1343-6.

6. Wouters BJ, Lowenberg B, Erpelinck-Verschueren CA, et al. Double CEBPA mutations, but not single CEBPA mutations, define a subgroup of acute myeloid leukemia with a distinctive gene expression profile that is uniquely associated with a favorable outcome. Blood. 2009;113:3088-91.

Posted on

Amyloid Typing by Liquid Chromatography-Tandem Mass Spectrometry

Technical Brief

Amyloid Typing by Liquid Chromatography-Tandem Mass Spectrometry


Test Name

Amyloid Typing by Tandem Mass Spectrometry (ATMS R)

CPT Codes

88313
88399 – QTY (10)
88380
83789
88321

Methodology

Immunohistochemistry
Liquid Chromatography Mass Spectrometry (LC/MS)

Turnaround Time

2–3 weeks

Specimen Requirements

Type:
Formalin-fixed, paraffin-embedded tissue

Volume:
1 paraffin block

Transport Temperature:
Ambient

Background Information

Systemic amyloidosis is a rare condition characterized by deposits of amorphous material that interfere with the normal structure and function of tissues. Most often amyloid deposits are identified in the heart, kidney, and vascular walls, but virtually every organ system can be affected. All amyloid deposits are thought to be composed of proteins forming beta-pleated sheets, structures that render them insoluble and rigid.

Clinical Indications

Investigations leading to the diagnosis of systemic amyloidosis can be triggered by a variety of symptoms induced by heart or kidney failure, neuropathy, or coagulation abnormalities. Abnormalities suggestive of cardiac amyloidosis have been described by ultrasonography. Amyloid deposits can be identified during workups for low-grade lymphomas, plasma cell myelomas, familial conditions, or renal failure.

There are four major types of systemic amyloidosis: primary amyloidosis, familial amyloidosis, secondary amyloidosis, and senile amyloidosis. The most common form of amyloidosis, primary amyloidosis, is the consequence of deposits of immunoglobulin light chains. Primary amyloidosis is usually diagnosed in patients with plasma cell neoplasms, from monoclonal gammopathy to plasma cell myeloma. Familial amyloidosis is a consequence of inherited mutations, most common in the transthyretin gene. Transthyretin, this time in its wild-type form, is the main component of amyloid in senile amyloidosis, a condition most often diagnosed in the heart. With the decrease in the incidence of chronic inflammatory diseases, mainly infectious, and with better management of autoimmune disorders, the incidence of secondary amyloidosis has markedly decreased and is currently a rare disease. The main amyloidogenic protein in secondary amyloidosis is Amyloid A. Overall, at least 28 proteins have been described to be responsible for the formation of amyloid deposits.

In addition to the proteins that are considered amyloidogenic, amyloid deposits in all types of systemic amyloidosis constantly include other proteins: Serum P component (SAP), Apolipoprotein E (ApoE), Apolipoprotein A-I (ApoA-I), and Apolipoprotein A-IV (ApoA-IV).

Methodology & Interpretation

In histologic sections stained with hematoxylin-eosin, amyloid deposits can be difficult to differentiate from serum or dense collagen. Several stains have been developed to assist in the diagnosis of amyloid, with the Congo Red stain currently considered the gold standard. The microfibrillar nature of the amyloid deposits can be confidently identified by electron microscopy, while the beta-pleated sheet structure of the amyloid can only be demonstrated with x-ray diffraction, a technique exclusively used in research.

While, from a purely morphologic point of view, there are no significant differences between different types of amyloid, the treatment of each type of amyloidosis is different. Immunohistochemical stains show the amyloid deposits to be positive for SAP, but this does not always allow the differentiation of amyloid from serum. In many cases, stains for Transthyretin, Amyloid A, kappa, or lambda immunoglobulin light chains allow further characterization of the components of the amyloid deposits; however, in a significant number of cases, these techniques fail to identify with confidence the amyloidogenic protein. Factors that prevent a confident diagnosis include abnormal protein folding and truncation, as well as the presence of many other endogenous proteins in the amyloid deposits. This results in a significant fraction of cases being inadequately typed and, as a consequence, treated.

Recent studies have shown liquid chromatography-tandem mass spectrometry (LC-MS/MS) to be a reliable method in the identification of amyloidogenic proteins, and is considered by some groups as the current gold standard. This technique was initially used on fresh or frozen tissue, but recently it has been shown that analysis of formalin- fixed, paraffin-embedded tissue (FFPET) can lead to similar results. The analysis usually begins with visual identification of amyloid deposits, followed by their dissection under the microscope (laser microdissection). The specimen is then digested with trypsin, resulting in the generation of peptide fragments. LC-MS/MS is then used to analyze these peptide fragments, resulting in an m/z spectrum. The specific m/z characteristics of the different peaks are compared to those in several databases, leading to the identification of the peptide fragments in the amyloid digested by trypsin. These peptide fragments are quantified and the higher the number of peptide fragments originating from a particular amyloidogenic protein, the higher the degree of confidence that the particular protein is a component of the amyloid. Peptides from the structures of SAP, Transthyretin, ApoE, ApoAI, and ApoA-IV are used as internal controls, indicating the adequate identification of amyloid. When more than one amyloidogenic protein is identified, a comparison of the relative abundance of peptide fragments can indicate which protein is the most abundant in the sample.

This amyloid typing test allows typing of the amyloid deposits with a precision superior to the other available techniques. It incorporates multiple internal controls and allows amyloid typing to be performed in archived specimens. When necessary, in addition to the LC-MS/MS, alternative techniques, such as immunohistochemical stains, can be employed.

Limitations

This test is not a substitute for a surgical pathology consult.

The diagnosis of amyloidosis should not be made by mass spectrometry, as this method has not been developed as a substitute for a detailed morphologic analysis, Congo Red stain, or immunohistochemistry.

Amyloid analysis by tandem mass spectrometry requires that a sufficient amount of amyloid is microdissected. In a few cases, the assay may fail due to the insufficient amyloid available.

In some cases, additional immunohistochemical stains are necessary in order to increase the confidence with which the diagnosis is rendered.

References

1. Sipe JD, Benson MD, Buxbaum JN, et al. Amyloid fibril protein nomenclature: 2012 recommendations from the Nomenclature Committee of the International Society of Amyloidosis. In Amyloid, 2012; 19(4):167-170.

2. Lavatelli F, Vrana JA. Proteomic typing of amyloid deposits in systemic amyloidoses. In Amyloid, 2011; 18(4):177-182.

3. Vrana JA, Gamez JD, Madden BJ, et al. Classification of amyloidosis by laser microdissection and mass spectrometry-based proteomic analysis in clinical biopsy specimens. In Blood, 2009;114(24)4957-4959.

Posted on

Prostate-Specific Antigen (PSA) – Reference Range Update

Technical Brief

Prostate-Specific Antigen (PSA) – Reference Range Update


Test Name

Prostate Specific Antigen, Diagnostic (PSA)

CPT Codes

84153

Methodology

Electro Chemiluminescence Immunoassay (ECLIA)

Turnaround Time

8 hours

Specimen Requirements

Type:
Plasma

Volume:
1 mL

Minimum Volume:
0.3 mL

Collection Container:
Green BD Hemogard™ Lithium Heparin Tube

Transport Temperature:
Refrigerated

Alternative Specimen Requirements

Type:
Serum

Volume:
1 mL

Minimum Volume:
0.3 mL

Collection Container:
Gold BD Hemogard™ Serum Separation Tubes (SST)™

Transport Temperature:
Refrigerated

Stability

Ambient:
24 hours

Refrigerated:
5 days

Frozen:
24 weeks

Background Information

Prostate-specific antigen (PSA) is a serine protease (~30kDa) secreted almost exclusively by prostate epithelial cells.  PSA was first described in 1979 when it was detected in blood; the concentration of PSA was increased in cases of prostate cancer or other prostatic diseases, such as benign prostatic hyperplasia.[1]

Serum PSA measurement was shown to enhance early detection of prostate cancer, leading to the recognition of its potential as a screening test.[2] Serum PSA alone, or combined with a digital rectal exam (DRE), have been used in clinical trials for early detection of prostate cancer.[3-4] A recent multicenter-study using serum PSA tests with various cutoffs between 2.6 and 4.0 ng/ml showed a 20% reduction in prostate cancer-specific mortality.[4]

Limitations

PSA as a marker is only prostatic tissue-specific rather than cancer-specific. Increased PSA in serum was not only detected in patients with prostate cancer, but also in benign prostatic disease.[1] This phenomenon resulted in a significant false positive rate in PSA-based detection of prostate cancer based on biopsy results from those patients.

Additionally, PSA-based detection of prostate cancer often resulted in over-diagnosis of low-grade cancer that may have never become clinically significant. Several approaches to improve the distinction between cancer and benign conditions have been proposed, including the use of age-adjusted PSA reference ranges, PSA density, PSA velocity, and free-to-total PSA ratio.

Clinical Significance

The traditional cutoff for serum PSA is 4.0 ng/ml. PSA values >4.0 ng/mL were considered abnormal, and these patients were further evaluated with invasive diagnostic approaches, such as prostate biopsy or transrectal ultrasonography of the prostate.[1] However, multiple studies suggest that the risk of prostate cancer in men with PSA levels <4.0 ng/mL is significant (see Table 1). For example, the prostate cancer prevention trial (PCPT) included 2.950 participants who had PSA levels < 4.0 ng/mL and underwent an end-of-study biopsy. Results showed that more than 15% of these men had prostate cancer.[5]

The detection rate of prostate cancer is about 47% in men with serum PSA in the range of 4-10 ng/mL.[5] However, the cancer rate is very similar for men with a PSA range of 2.0-3.0 ng/mL(23%) and that with PSA of 3.0-4.0 ng/ml (26%).

Table 1. Likelihood of Cancer, Based on PSA Level

PSA (ng/mL)

≤ 1.0
1.1 – 2.0
2.1 – 3.0
3.1 – 4.0
4.1 – 10.0
> 10.0

Risk for Prostate Cancer on Biopsy

8.8%
17.0%
23.9%
26.9%
47.0%
58.2%

Data from the prostate cancer prevention trial demonstrated that there is no PSA level below which the risk of having prostate cancer is zero, and suggests that there is no “normal” reference range for PSA. The detection rate of prostate cancer is significantly correlated to the serum PSA levels.

Lowering the PSA cutoff of 4.0 ng/ml to 2.6 ng/ml would increase detection of prostate cancer, while also slightly increasing false positive results.[6-8]

Test Update Information

The new PSA reference range is 0-2.59 ng/ml; the upper limit is cutoff value for further evaluation.

The following comment will be included with each PSA result:

“For an individual patient, the significance of a PSA level should be interpreted in a broad clinical context, including age, race, family history, digital rectal examination, prostate size, results of prior testing (prostate biopsy, free PSA, PCA3), and use of 5-alpha-reductase inhibitors. Considering the high incidence of asymptomatic cancer in the general population that may not pose an ultimate risk to the patient, the decision to recommend urological evaluation or prostate biopsy should be individualized after considering all of these factors.”

A useful tool that incorporates many of these variables for calculating the risk of cancer is available at myprostatecancerrisk.com. This information may assist physicians in deciding whether a prostate biopsy is appropriate.

References

1. Cooner WH, Mosley BR, Rutherford CL, Jr. et al. Prostate cancer detection in a clinical urological practice by ultrasonography, digital rectal examination and prostate specific antigen. J Urol 1990;143:1146-52; discussion 1152-4.

2. Catalona WJ, Smith DS, Ratliff TL et al. Measurement of prostate-specific antigen in serum as a screening test for prostate cancer. N Engl J Med 1991;324:1156-61.

3. Andriole GL, Crawford ED, Grubb RL 3rd, Buys SS, Chia D et al. [PLCO Project Team]. Mortality results from a randomized prostate-cancer screening trial. N Engl J Med. 2009;360(13):1310-9.

4. Schröder FH, Hugosson J, Roobol MJ et al. ERSPC Investigators. Screening and prostate-cancer mortality in a randomized European study. N Engl J Med. 2009;360(13):1320-8.

5. Thompson IM, Pauler DK, Goodman PJ et al. Prevalence of prostate cancer among men with a prostate-specific antigen level < or =4.0 ng per milliliter. N Engl J Med. 2004;350:2239-46.

6. Catalona WJ, Smith DS, Ornstein DK. Prostate cancer detection in men with serum PSA concentrations of 2.6 to 4.0 ng/mL and benign prostate examination. Enhancement of specificity with free PSA measurements. JAMA. 1997;277(18):1452-5.

7. Müntener M, Kunz U, Eichler K et al. Lowering the PSA threshold for prostate biopsy from 4 to 2.5 ng/ml: influence on cancer characteristics and number of men needed to biopsy. Urol Int. 2010;84(2):141-6.

8. Punglia RS, D’Amico AV, Catalona WJ, Roehl KA, Kuntz KM. Effect of verification bias on screening for prostate cancer by measurement of prostate-specific antigen. N Engl J Med. 2003 Jul 24;349(4):335-42.